These bulletins follow the same format of the ‘four Yorkshires’ bulletin minus that for out of work benefits as these numbers are not available at local authority level from 2015. So this bulletin will map out NOMIS employment and employment related data on employment (EM), unemployment (UNEM and Economic Inactivity (EcIn) in each of Yorkshire’s 13 local authority areas (not including combined authorities, Harrogate or Scarborough town councils).
| Sheffield City Council | South Yorkshire | Leeds City Council | West Yorkshire |
| Barnsley | South Yorkshire | Kirklees | West Yorkshire |
| Doncaster City Council | South Yorkshire | Calderdale | West Yorkshire |
| Rotherham | South Yorkshire | Wakefield City Council | West Yorkshire |
| York City Council | North Yorkshire | Bradford City Council | West Yorkshire |
| North Yorkshire | North Yorkshire | Hull City Council | East Yorkshire |
| East Riding Council | East Yorkshire |
Employment
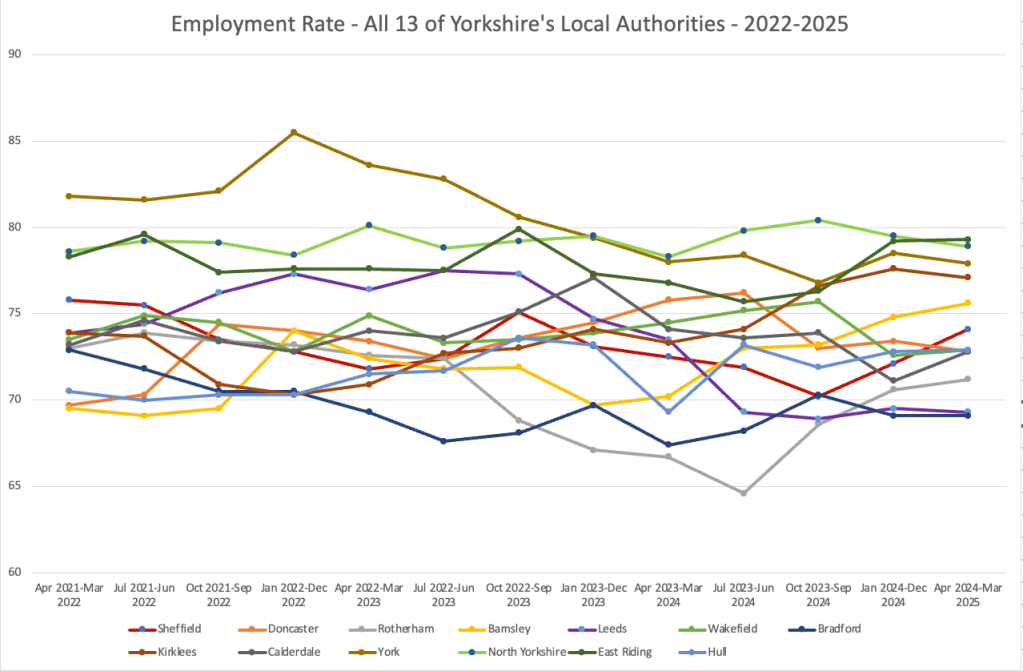
The employment patterns and trends for all of Yorkshire’s local authorities are not that clearly represented by the ‘jumble’ graph below. For this reason these are separated out in a number of ways in other graphic forms. However, some broader comparative trends over the seven year period chosen can be pointed to in order to raise further questions.
Firstly, it is clear to see that York City Council was the best performing for much of this period whilst Bradford was the worst performing. However both appear to converge to join the broad cluster consisting of the rest of Yorkshire’s local authorities. There are suspicions that this is due to problems or changes in regards to the data rather than a actual labour market phenomena, at least in the case of Bradford city council where the sharp rise in the rate of employment in 2020 would be surprising given the wholly negative employment effects everywhere else was seeing in that year. For York however a post-pandemic boom might well have been enjoyed in 2021 going into 2022 as economies opened out and domestic tourist hotspots were enjoyed at a time when overseas holiday destinations were yet to be braved (to pre-pandemic levels).

The above ‘jumble’ is much clearer when the timeline is adjusted to a more recent 3 year window (2022-2025).
What becomes clear, particularly when compared with the longer seven year timeline, is the degree of fluctuation and volatility that some local authority areas exhibit compared to others. Leeds and Bradford, although neighbours in West Yorkshire, do not appear to be well tied for even much of the last three years, but curiously began to converge from the end of 2022 mostly as a result of Leeds’ sharp drop in its employment rate from 2022. Neighbours Barnsley and Doncaster exhibit the most volatility and appear to be (relatively) closely tied. Separating out these local authorities by region (i. west, ii. south, iii. north and east Yorkshire) makes these trends easier to identify.
West Yorkshire does not appear to demonstrate much in the way of shared trends with the exception of Calderdale and Wakefield. Calderdale and Wakefield in fact seem follow a pattern similar to South Yorkshire, something that would warrant deeper examination if this pattern persisted.
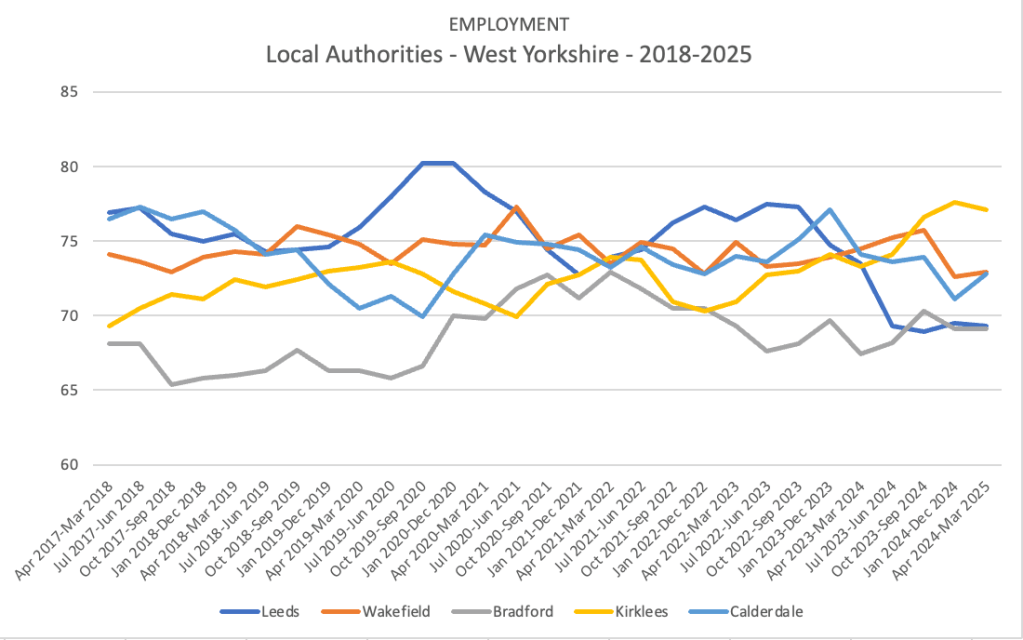
In the case of Wakefield, some semblance of a neighbour effect would intuitively make sense, but the case of Calderdale it would not given it does not even share a boundary with Wakefield in its own West Yorkshire let alone those councils in South Yorkshire. Some abstracted comparative similarities between these local authorities’ economies and labour markets might be pointed to, particularly between each minus Sheffield given it is a city of much greater population size.

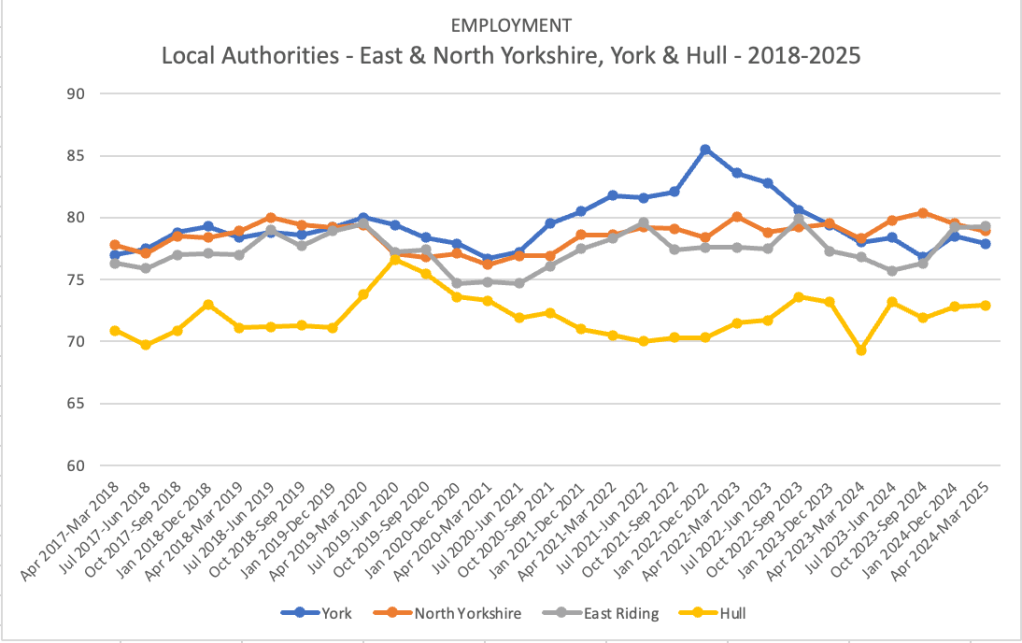
The case of North and East Yorkshire, inclusive of the cities of York and Hull, show a high degree of shared pattern, with the exception of Hull, although each have shown a high degree of stability with the exception of the two cities. It is important to note that we would be better served if North Yorkshire’s numbers were further divided into sub-regions given this county council authority’s vast geographic size. The fact its more populated areas are found in its north east (near York) and far north west areas bely any attempt to suggest that North Yorkshire’s trends are homogenous and simply follow the trendline of the City of York because of any gravitational economic pull York may possess. Much of north Yorkshire on the western side would have its economic reference point being more directed to Bradford and Leeds, as well as Harrogate area, than it would to York. However, the data available is what it is available.
This final table pulled together looks at the city-based local authorities in Yorkshire:
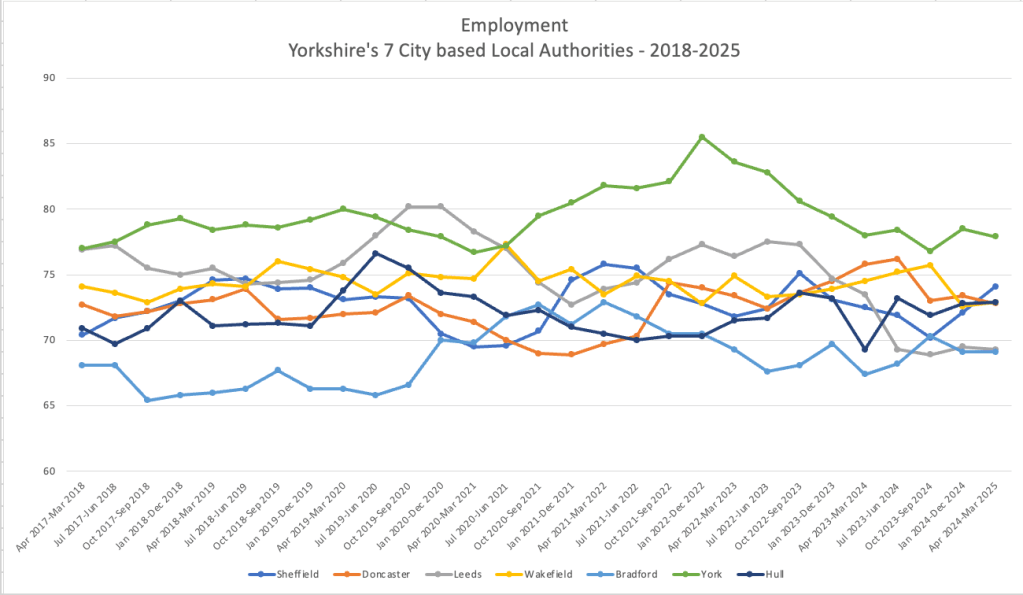
Besides underlining the convergence of Leeds and Bradford mentioned above, as well as York’s long-standing strong performance, the above set of trendlines sees a historically fluctuating Sheffield continue into and through 2025 with the same upward trajectory it entered the year with. Whereas Doncaster, Wakefield and Hull seem to almost exactly the same 73% employment rate.
Unemployment
For the first time we have to note a hole in the NOMIS data. North Yorkshire is not provided for in any data on unemployment, a point raised with NOMIS and underlined own statistical release from July here where charts are available for other labour market trends but not for unemployment.
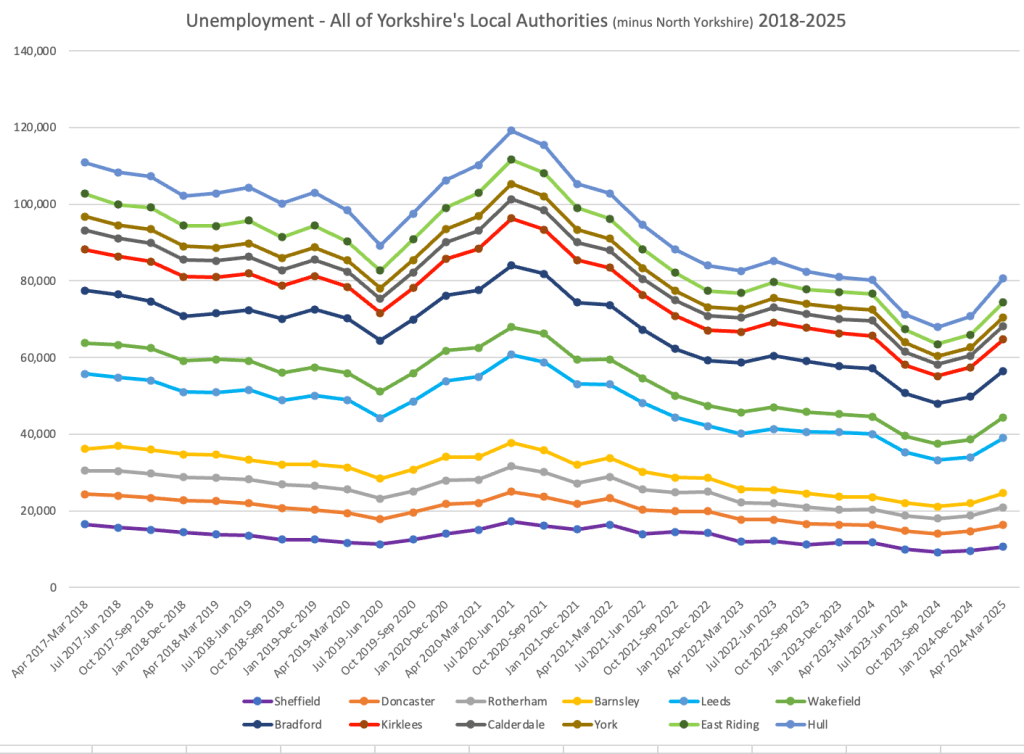
An additional problem with the NOMIS data is provided is that to group data for all of the councils for unemployment we can only use raw numbers rather than the rate, however the trendlines provide an indication graphically of trends and rate of changes to said trends. The trends present a similar picture for all local authorities in Yorkshire with clearly defined periods:
- A pre-pandemic period where a steady decline then hits an abrupt end in 2020
- A pandemic period with a sharp increase
- An immediate post-pandemic period of sharp decline (2021-2022)
- A period from 2022-2024 where unemployment stabilizes
- Then a period to the current day defined by a clear ‘u-shape’ pattern where unemployment drops sharply only to rise sharply, a trend that continues as we hit mid-2025
What is notable on this final point, when making a simple comparison across Yorkshire’s local authorities, is that this u-shape pattern is far more pronounced (deeper) for those councils not in South Yorkshire. Of course, this could be an issue with the data, so the data has been presented in the same form of ‘jumble’ line graph as done above in the employment section to see if this presents itself.
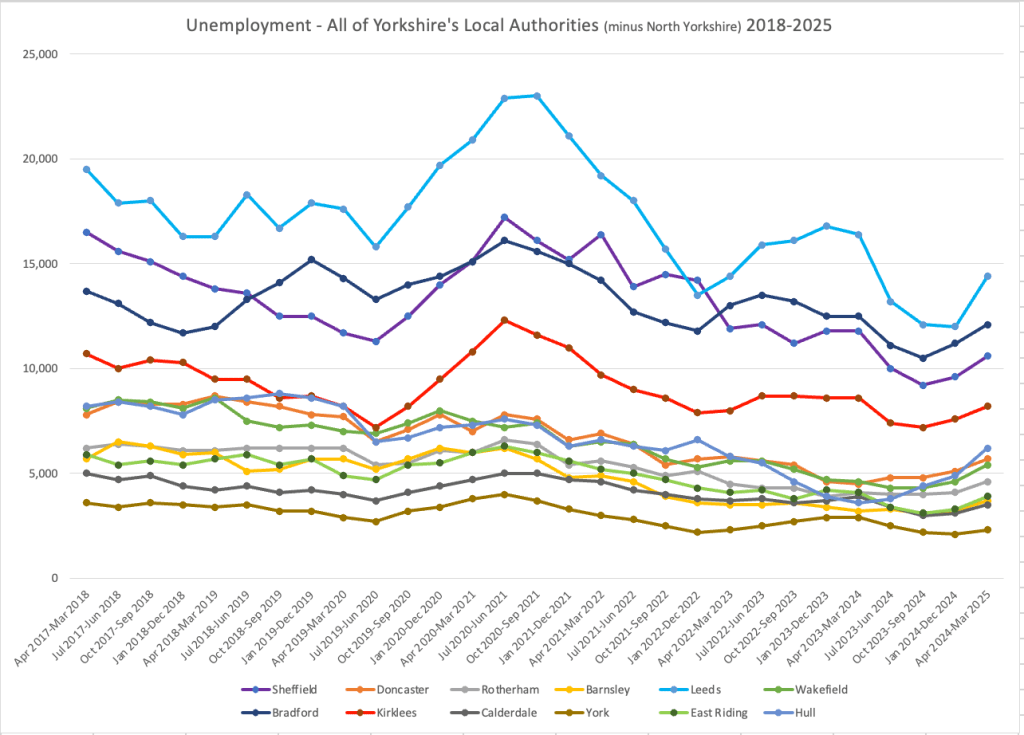
The u-shape for the 2024-2025 period is still evident, even if slightly less pronounced across all councils. However, Sheffield exhibits a pronounced u-shape in this graph as does Bradford and especially Leeds. These three cities, the three largest in Yorkshire, also clearly exhibit the greater volatility which, given their diverse economies compared to the other council areas, isn’t surprising. Leeds exemplifies this point as the largest city and city economy in Yorkshire, presenting a great deal of turbulence over time including a very pronounced ‘pandemic effect’ (coming in and out of the pandemic) and, more recently, having a very pronounced u-shaped trend that sees a current rate of sharply rising unemployment.
A brief look at a regional breakdown within Yorkshire also reveals similar patterns. Sheffield is far more volatile than the other councils in South Yorkshire with little convergence between Sheffield and the other three councils. With this, the sharp rise in unemployment in Sheffield is not quite as evident in the three other council areas, but we’ll review whether this changes or not.
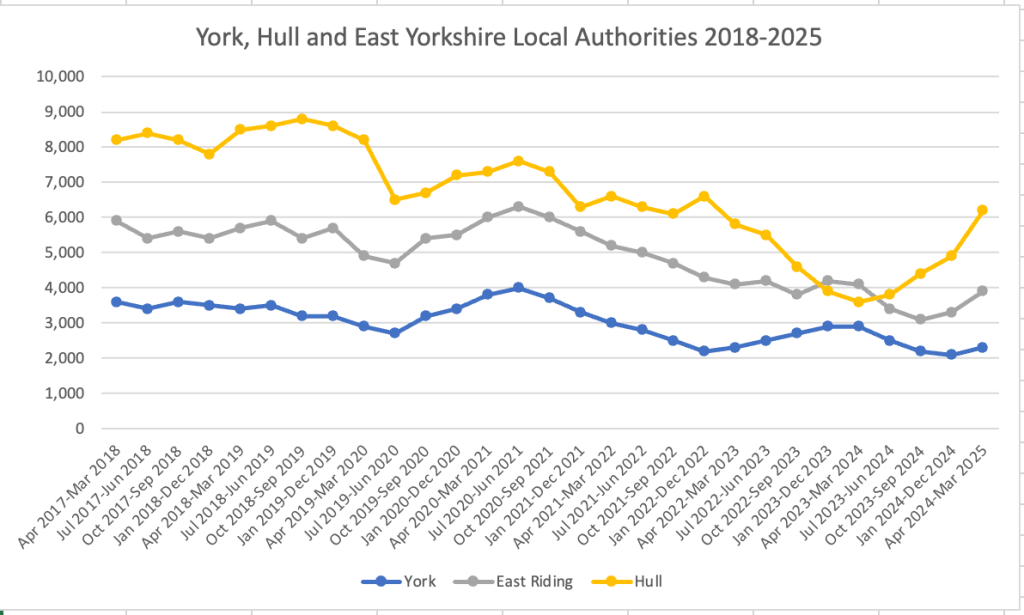
In West Yorkshire by contrast there is a clear difference in that they each followed a similar pattern; with this a sharp rise in unemployment is now in train. Again, it is regrettable that we don’t have numbers for North Yorkshire. However we should note the trendline for the city of Hull which has spent much of the last 7 years being higher than the East Riding of Yorkshire that surrounds, but saw it converge with (and even drop below) that of its neighbour briefly in as 2023 turned into 2024. As unemployment turned back upward everywhere this rise was particularly and concerningly sharp in Hull.
Economic Inactivity
The graphics for each of these will present again a comparative ‘jumble’ for each of the 13 local authorities across Yorkshire as well as separated trendlines in the following areas of economic inactivity: i) topline economic inactivity trends, ii) economically inactive due to long-term sickness, iii) economically inactive due to looking after family, iv) economically inactive but wants a job and v) economically inactive but doesn’t want a job.
Topline
Bradford, Doncaster, Leeds and York present the more volatile trend lines as local authorities in the county. York and Bradford, in very different ways, ended up returning to their pre-pandemic rate of economic inactivity (20% and 28% respectively).

The most volatile trendline, and that which has seen the biggest change, is that of Leeds. Having hit a low mark of 16% at the back end of 2020, it had nearly doubled to 30% by the middle of 2024 and in by the latest statistical release in 2025 is the highest in Yorkshire with the exception of Sheffield. Looking across the 13 authorities, a general pattern can be identified where most were sat in the 20-to-25 percent bracket, with the exception of Kirklees and Bradford whom were above (27 and 28% respectively) whilst North Yorkshire sat below (18%).

This graph provides a shorter 3 year trendline view where trendlines in a post-pandemic period are easier to plot. One notable dual set of notable trends comes with those local authorities whom are seeing rising economic inactivity (Sheffield Doncaster Rotherham and York) and those whom are not (the remaining 9 local authorities). Given that Barnsley, the one remaining South Yorkshire authority beyond three noted above, is hardly seeing much of a downward trendline, it is worth asking why is South Yorkshire seeing a divergent trend from the rest of Yorkshire.
Economically inactive – Long-term sick
Long-term sickness has been the biggest and most concerning driver of economic inactivity across the UK since the pandemic. As can be noted from the ‘jumble’ table below, there were two solid sets of clusters plus two outliers (York the lower, Doncaster marginally the upper outlier) pre-2020. With the onset of the pandemic a broader disturbed pattern is evident with some considerable variation.

Clearly, entering in the pandemic around 2020, many of the long-term health conditions were those non-covid19 related. As Britain’s labour market came out of the pandemic from 2022 onwards these sorts of reasons would logically have become more of a driver, although the more detailed data on the types of long-term sickness including mental health and musculo-skeletal conditions, can be accessed to examine this. What is notable at a comparative authority-by-authority viewpoint is that despite Hull’s overall dropping rate of economic inactivity up to 2025, it has seen a sharp and continuing rise in economic inactivity due to long-term sickness. York and Leeds saw relative stability, certainly compared to the highly volatile trendlines for all other local authorities in Yorkshire. More notably however in terms of trendline, Only York and Leeds aren’t seeing a rise in this driver of economic inactivity, both hovering at the 22% mark. A new cluster has appeared to have formed however comprising of Bradford, Sheffield, Doncaster, Kirklees as well as North and East Yorkshire, each sitting in 2025 in the 25-28% range.
The below chart gives a clearer view of each individual council and its own trajectory on this driver of economic inactivity. A rough division here on the trendlines, and not the rate, between two camps. All of South Yorkshire’s council areas, Calderdale, Bradford and Kirklees each exhibit a clearer post-mid-2023 steady rise, whilst Leeds, Wakefield and each of North and East Yorkshire’s councils are not to the same extent (but still are in most cases).

Economically inactive – Looking after family/home reasons
Having domestic and family responsibilities has been one of those interesting and key drivers of economic inactivity nationally but hasn’t been discussed perhaps as much as those health-related drivers above. It should be noted here pandemic didn’t appear to provoke an upward change in this measure, in fact if anything an overall fall in economic inactivity due to these reasons is noticeable across the board.
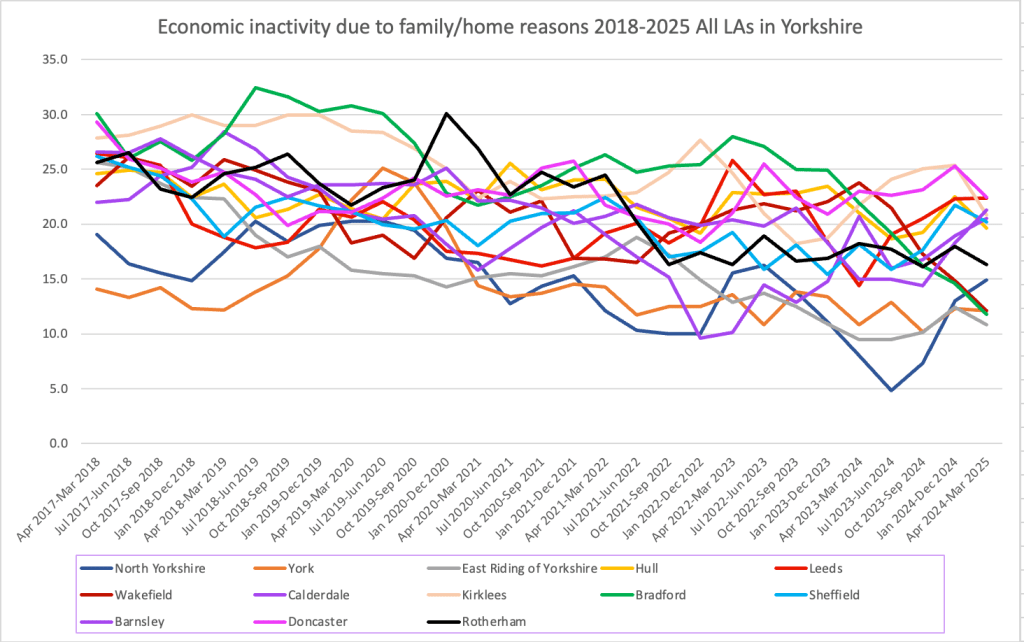
Taking a comparative view, and a generally high level of volatility, there are some notable regional patterns. In West Yorkshire, Bradford started as having the highest rate (across all of Yorkshire’s local councils not just West Yorkshire) only to see a precipitous drop from 2023 onwards to having the second lowest rate in the latest data in 2025, whilst the other councils in West Yorkshire coalesced around the 20-23% range. Notably, this same range is where much of South Yorkshire clustered with the exception of Rotherham.
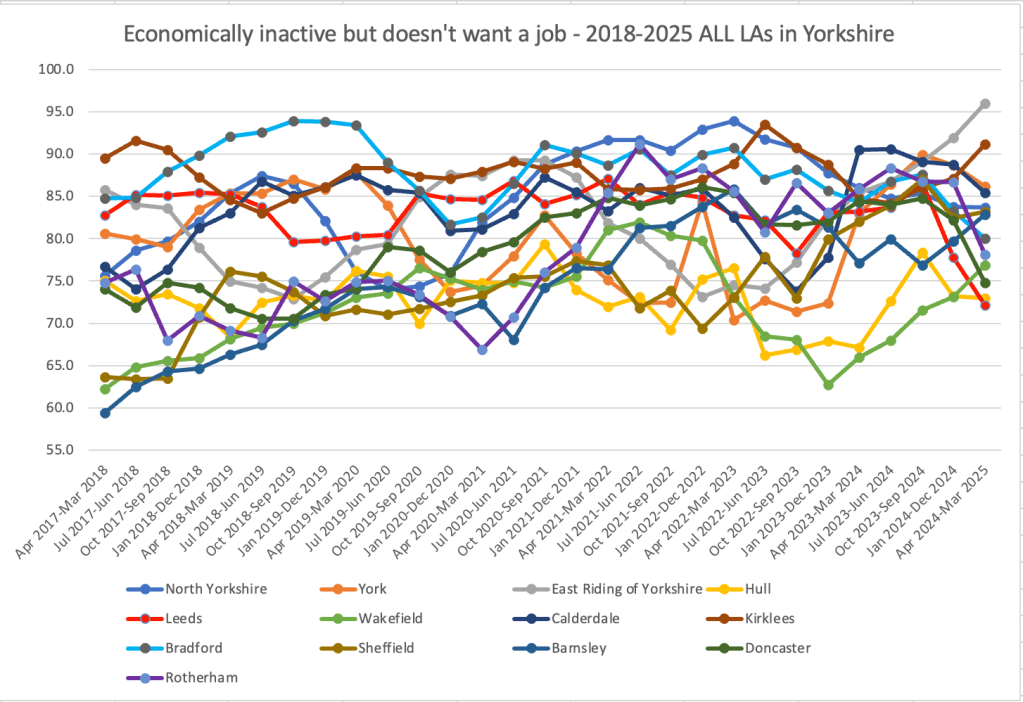
Economically inactive – Wants a job & doesn’t want a job
These two measures are perhaps the most vulnerable to factors better addressed by contextual/qualitative time-series analyses of shifts around intentions to work. More specifically, any changes to the question of the economically inactive ‘do you want a job?’ could be down to changes over time in individual attitudes to the challenge of finding work and/or having to work. These are also not numbers that give any indication as to the degree of effort made by the individual being sampled to find a job or the degree that work is sought or not sought. Attitudes are of course partly related to what jobs are available and the general mood around local labour markets that this forges.

There also is no discernible pattern pointing to any pandemic effect; if anything there seemed to be a rough convergence in both the want/don’t want a job among the economically inactive between the onset of the pandemic in 2020 to mid-2021. There is no notable patterns really to draw here; only commentary. Amongst the city based local authorities, all are seeing a rise in the number of those economically inactive that want work whilst two (Sheffield and Wakefield) are not, although the trajectory in Wakefield’s case is much steeper (and similar to its neighbours in Kirklees and Barnsley and, further afield, in the East Riding of Yorkshire).
Concluding comment
This bulletin was the first attempt in bringing together key statistical trends from UK Government/NOMIS data on the local authorities in Yorkshire. This attempt was as comprehensive as possible in terms of breadth/subjects covered, although there might be cause to separate out economic inactivity from employment statistics in future.
In terms of an overall picture painted from the available data presented in various forms above, with overall employment heading downward, unemployment heading up and economic inactivity remaining a stubborn problem (particularly that driven by health-related reasons), Yorkshire’s case will go to support a national narrative picture of a weakening labour market. LMI Yorkshire – Local Government Bulletin no.1

Leave a comment