The employment picture for Yorkshire’s four counties
This is the first LMI Bulletin for the four counties of Yorkshire. These Bulletins will develop and include more information and features, but here, as with all future LMI Bulletins for Yorkshire, we start with NOMIS-sourced data on employment/unemployment and economic inactivity for the four counties comprised of:
- the York and North Yorkshire Combined Authority (YNYCA) area (comprising of the City of York and North Yorkshire councils
- the West Yorkshire Combined Authority (WYCA) area (comprising of West Yorkshire’s 5 local authorities)
- the South Yorkshire Mayoral Combined Authority Area (SYMCA), comprised of its 4 local authorities) and,
- the Hull and East Yorkshire LEP area (comprising of the East Riding of Yorkshire Council and Hull City Council)
NOMIS does not provide a comparison feature for these four counties so have been pulled together for the purposes of this Bulletin. No political or historical significance are attached to these geographies, as of course many in God’s Own Country still favour the historic three Ridings. The main purpose of running this site however is try and paint a data-based picture of employment and work in Yorkshire using available data and these data are organised in UKGov sources (ONS, NOMIS etc.) according to the above mix of current combined and local authority maps and, usefully, Local Enterprise Partnerships (LEPs).
Un/employment
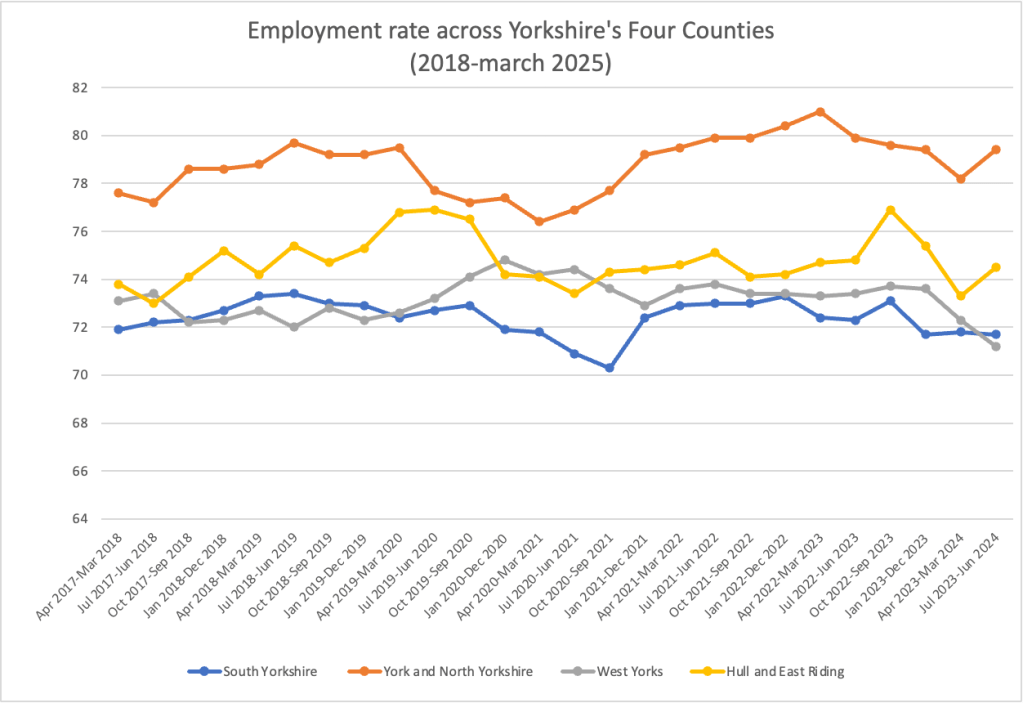
We start with a simple look at the employment rate across the four counties of Yorkshire which sees only some degree of convergence. North Yorkshire seems to enjoy a continuously strong employment rate whilst South and West Yorkshire have slightly lower employment rate. As is confirmed by the unemployment charts below, West Yorkshire’s employment rate has taken a sharp drop since the end of 2023. East Yorkshire has consistently been the more volatile since 2018 and despite a period of relative stability from 2020 to about 2023, from 2023 the employment rate started to become more volatile again.
As we turn to unemployment, it is possible to make out some possible casual relationships between employment and unemployment trends. It still however is not a picture we can paint without factoring in economic inactivity.
The two graphs below are from 2018 to the most recent 2025 data and from 2022 to the 2025 to present a 7 and a 3 year time frame. These present total numbers rather than percentages and rate, so the only discussion point raised here concerns comparative trajectories. As can be quickly noted looking at these graphs, the two most populous of Yorkshire’s counties (west and south) have seen the more volatile trends.

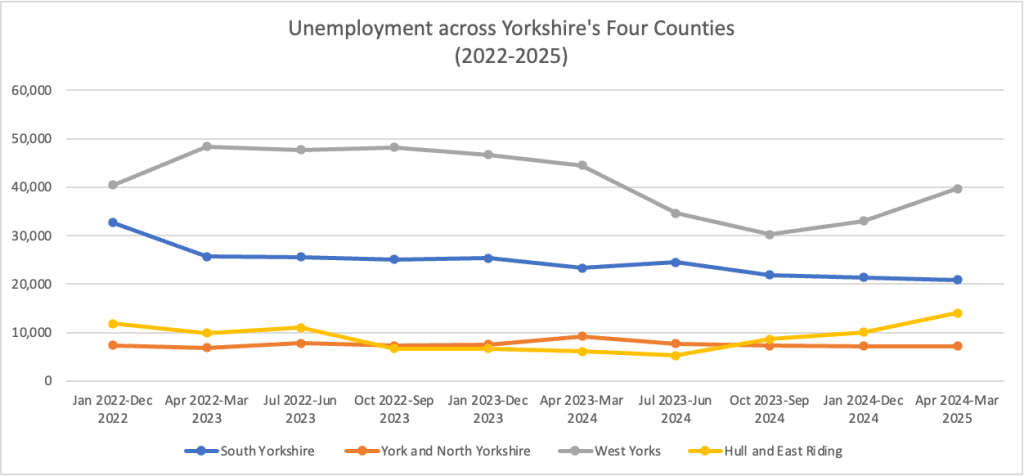
It is also very clear looking at the more recent portion of the timeline that West Yorkshire has seen a notable upward spike in its unemployment. Only Hull and East Yorkshire have seen kind of uptick in this unemployment number but still one far less than that of West Yorkshire. The reasons for this could be a return to a post-2022 trend which saw West Yorkshire’s unemployment numbers plateau around the 49,000-45,000 mark and the sudden drop from April 2024 now seeing a correction back to that norm. Other explanations may point to particular economic events such as large scale layoffs or stagnation in particular sectors, but this doesn’t seem to be the case minus some degree of the latter. This will have to be monitored.
Economic Inactivity
In the aftermath of the pandemic, economic inactivity (EcIn) had come to replace the simple duopoly of employment statistics of employment-vs.-unemployment, namely as it came to displace unemployment as the principal indicator of worklessness. Some whom are EcIn are claiming unemployment benefits (universal credit), whilst some do not. Crucially, many whom are EcIn are kept out of the labour market due to family reasons or long-term health reasons. Five sets of data are provided below. The first is the (1) total numbers of EcIn across Yorkshire and its four counties, (2) those EcIn to look after family, (3) EcIn due to long-term sick, and those (4) EcIn who want a job and (4) those who do not want a job.These are again presented with two post-2018 and post-2022 time windows.
Economic Inactivity – Population Totals – Yorkshire and its 4 counties

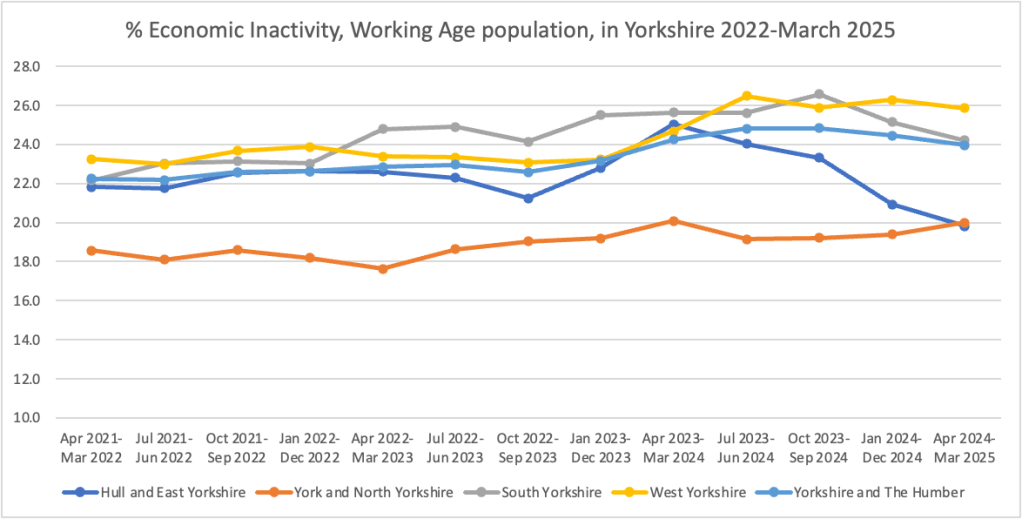
One would expect the West Yorkshire’s trend line would cohere to Yorkshire’s overall trend line to a large extent given the statistical reality presented by West Yorkshire having the largest population out of the four counties (barring any particular anomalies or extreme events in one of the three counties presenting themselves and skewing overall figures). In the above graphs we can see West and South Yorkshire consistently showing similar trend lines to each other, to the wider county and indeed to national trends. North Yorkshire however appears to have adjusted itself from the pandemic shock and broadly returned to the 19-20% EcIn rate it exhibited before 2020. East Yorkshire however has shown considerable volatility both before and after the pandemic period. Moore important for East Yorkshire, it has also seen a sharp drop in its EcIn rate since April 2023 from 25% to around 20% in March of this year. This sees East Yorkshire come into line with North Yorkshire rather than cohere to West and South Yorkshire which it had done since early 2021.
Economic Inactivity – Looking after Family – Yorkshire and its 4 counties
Looking after family has been a key driver of the national rise in EcIn yet what often overlooked as long-term health conditions are given focus.
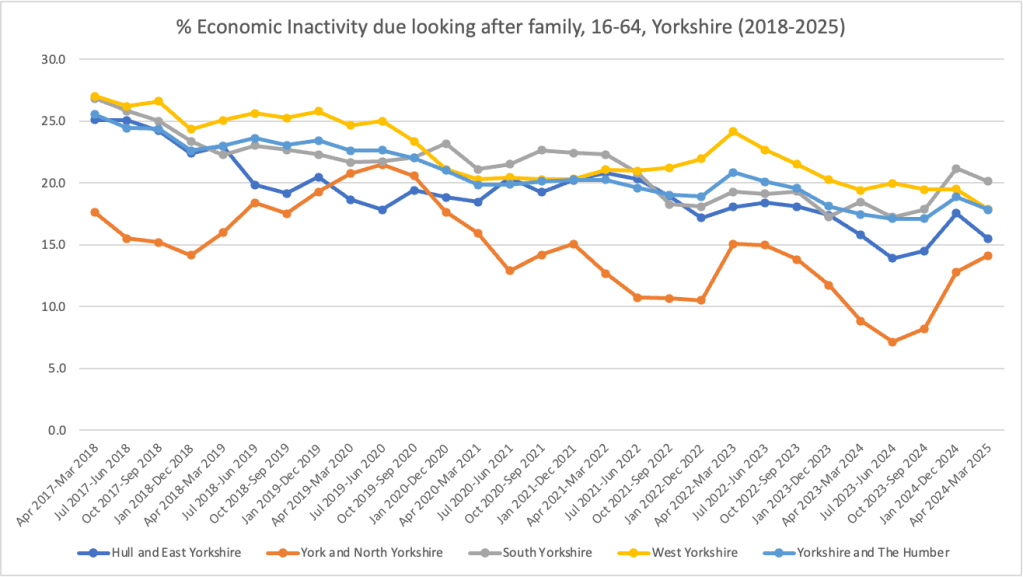
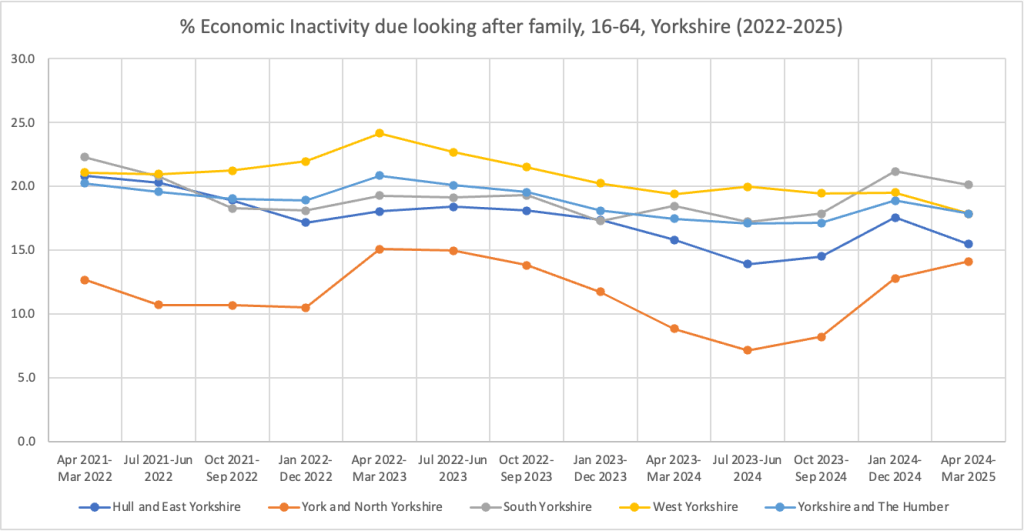
Nationally, and in Yorkshire as a whole, there has been a progressive decline in the number of those staying out of work to look after family. This is reflected with some variation with East, South and West Yorkshire, but North Yorkshire is on a clear upward trajectory and has been since 2023.
Economic Inactivity – Long-Term Sick – Yorkshire and its 4 counties
Those EcIn due to long-term illness has been the most prominent and stubborn driver of high EcIn nationally and is not bucked by any Yorkshire trend, either as a whole or by its individual 4 counties.
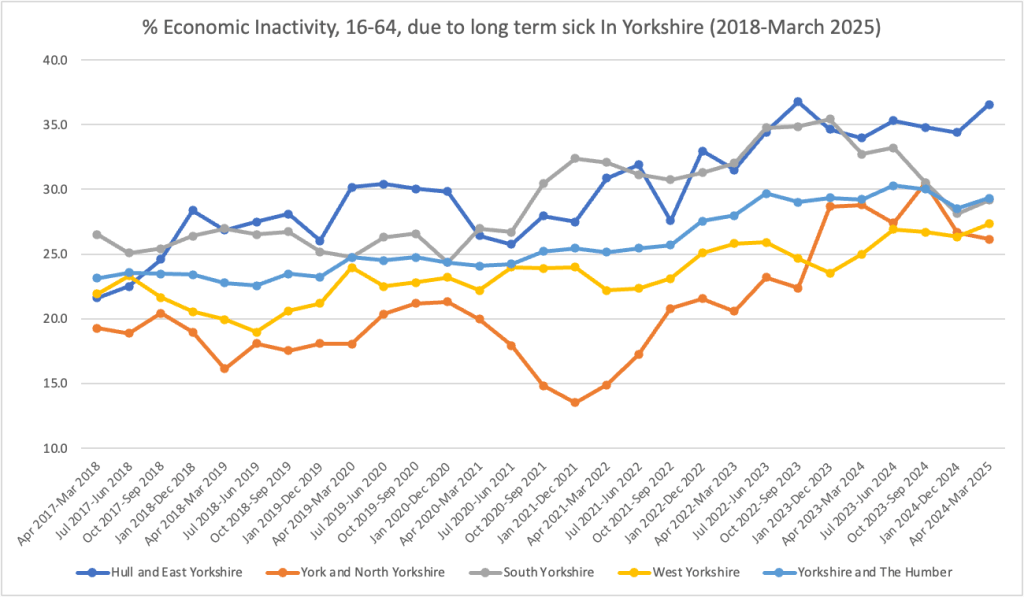
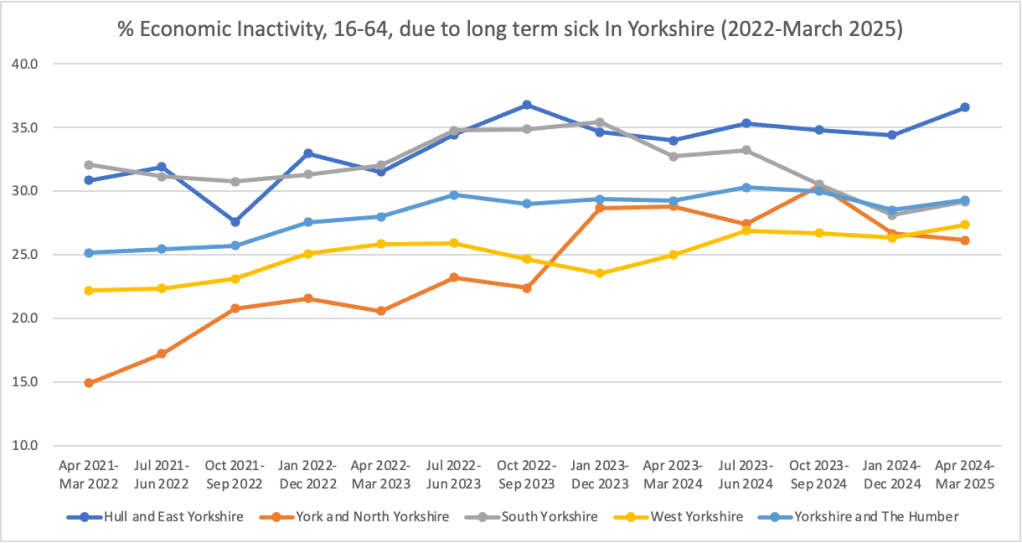
North Yorkshire again, with some notable volatility, has seen a sharp rise come after an unusual sharp fall as 2020 turned into 2021. West Yorkshire, whilst still seeing a persistent rise, has not been as volatile and as of March 2025 sits at around the same 27-30% level as South and North Yorkshire, and Yorkshire as a whole. South Yorkshire had, up until end of 2023, a similarly high rate of EcIn due to long-term sickness as East Yorkshire, but this has dropped since to conform to the Yorkshire wide norm noted above. East Yorkshire again, has a persistent and relatively high rate and one that may still be rising. This is something that requires local level attention from local government, NHS and industry stakeholders to understand.
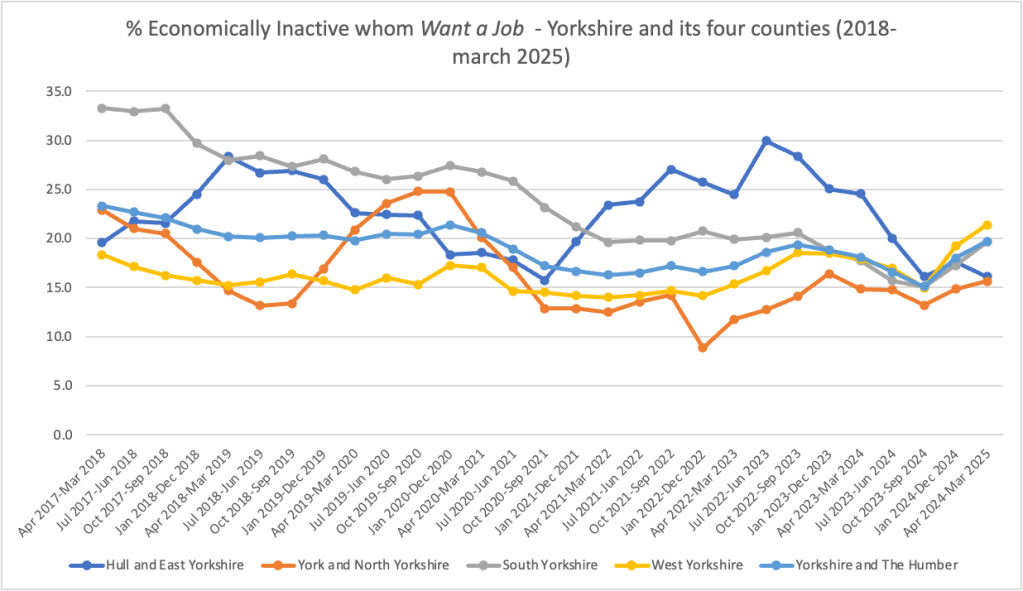
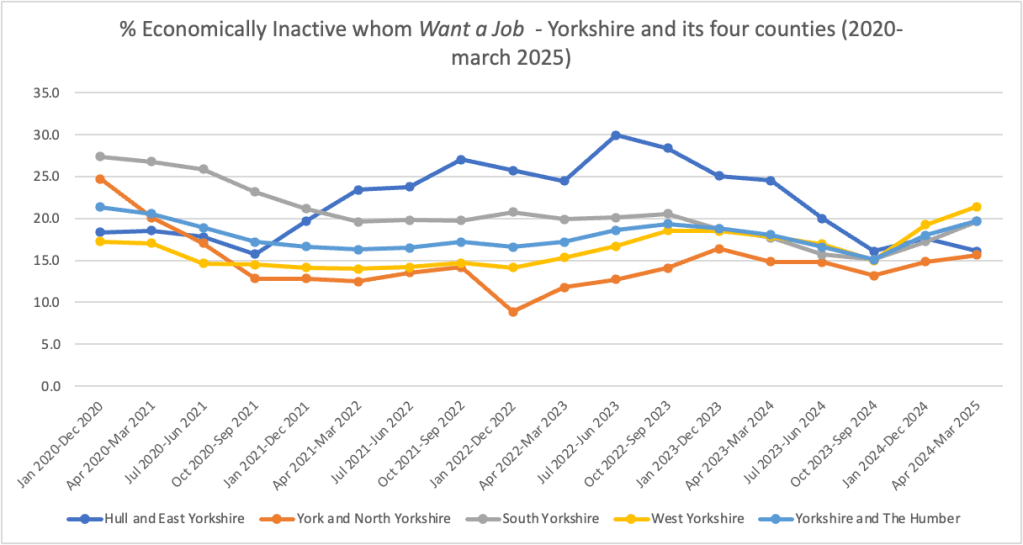
Economically Inactive but wants a job – Yorkshire and its 4 counties
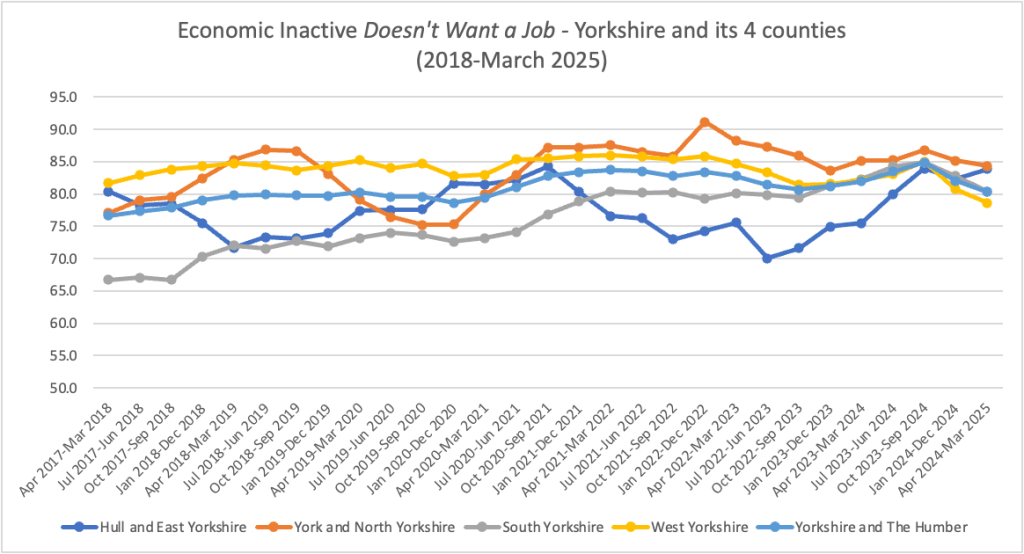
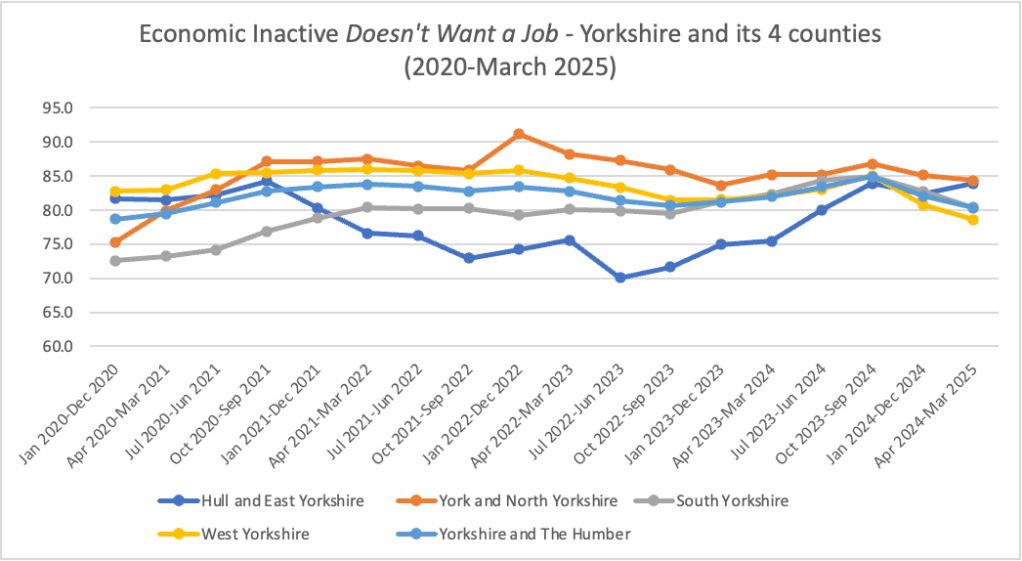
Both sets of graphs below for the EcIn who do and do not want a job present an issue in regards to statistical observations made around the back half of 2024. Around these time all trend lines appear to converge in a manner that can’t be viewed with anything other than skepticism. Recent stories like this one have highlighted problems the ONS and the Labour Force Survey (LFS) have had in sampling citizens’ attitudes to work (i.e. seeking it, or not). The trends, and East Yorkshire’s volatility in particular, are noted below nonetheless.
Economically Inactive but doesn’t want a job – Yorkshire and its 4 counties
Out of Work Benefits
Out of work benefits have seen very steady trends for Yorkshire and its four counties, with no or little volatility to note. As these are totals and not percentages, the higher numbers are largely by virtue of differences in population. West Yorkshire however from late 2023 so its out of work benefit number steadily rise from around 70,000 to just under 80,000 today. This is a slight drop from just over 80,000 hit in the summer of 2024.

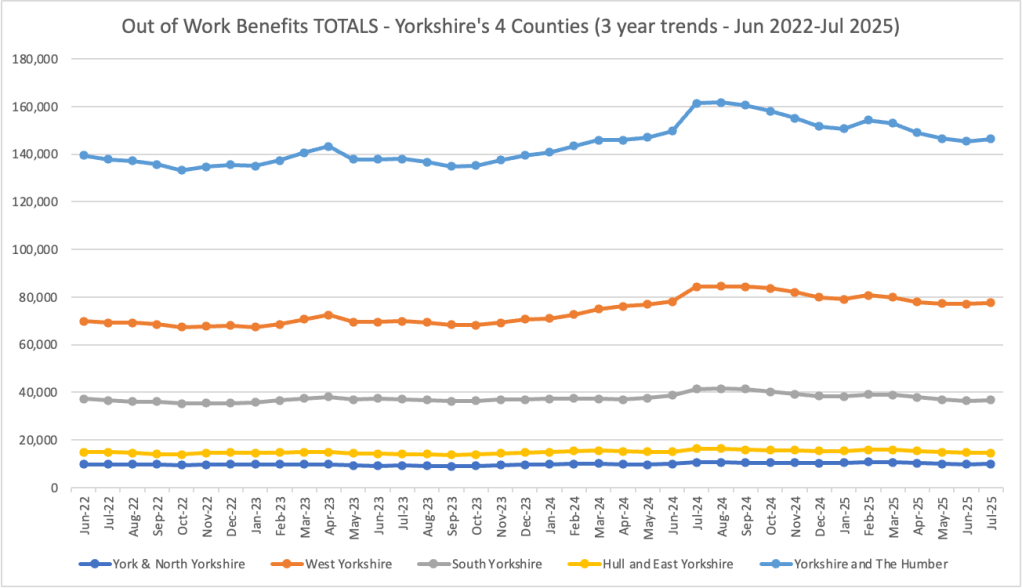
Benefits numbers needs to be looked at in reference with economic inactivity numbers given the complicated relationship and overlap between them. Some of those who are EcIn receive benefits whilst others do not, whilst some may respond to survey questions as ‘not looking for work’ whilst being EcIn and receiving certain forms of benefit they should not do if they aren’t in fact looking for work. It is of course noted the same unhelpful post-2024 convergence noted in the latter part of the EcIn bulletin does not help any statistical inferences to learning more about these problems.
Take-aways
At the time of writing the economic outlook is hanging over possible rises in unemployment and resulting benefit claimant numbers. This will need to be looked at. Economic inactivity has appeared to have dropped marginally overall in national terms, but the persistent increase in the InEc due to long-term sick is a continuing challenge and especially for East Yorkshire. This will should be monitored in examined further.
It is hoped that we will add more to these bulletins over time, particularly with local and industry sources and data that will important qualitative context and explanations to the quite rough statistical picture painted above. One of the key things on the subject of industrial context is the stark difference presented by city-centric regional economies like those in South and West Yorkshire and those which have far larger agricultural elements to their economies like East and North Yorkshire. Clearly, these latter two have city-based drivers of population and commercial activity in the form of Hull and York, whilst South and West Yorkshire also have rural economic parts.

Leave a comment